The Surprising Linchpin in the Global Supply Chain
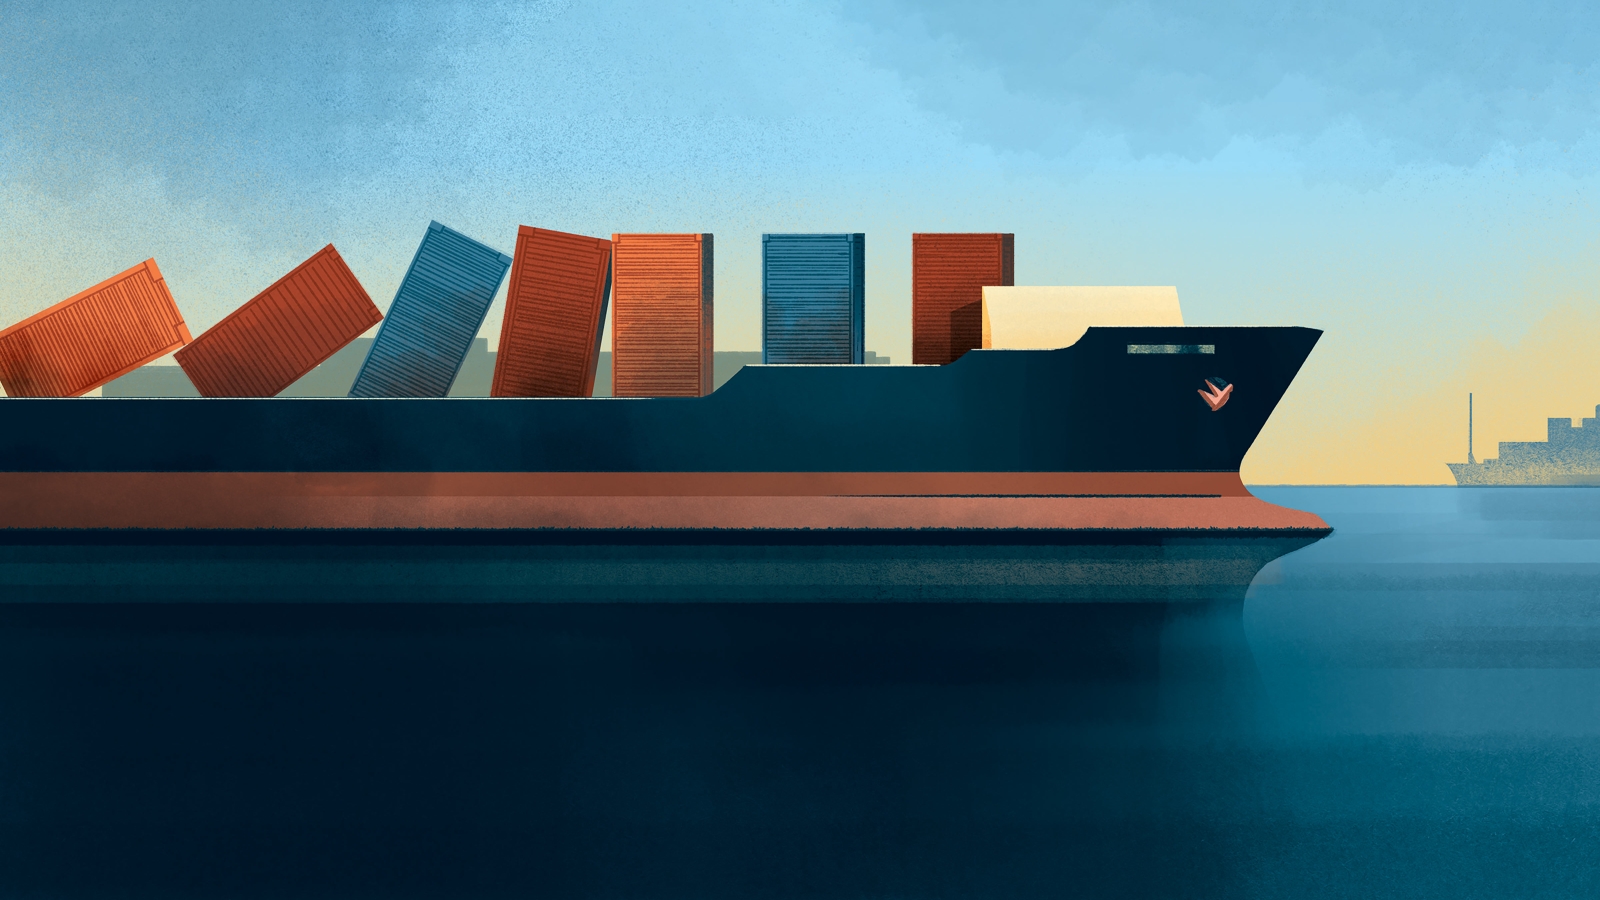
When massive cargo ships arrive late to a port, the delay sets off a domino effect that directly influences U.S. inflation, according to research from Jesús Fernández-Villaverde, Howard Marks Presidential Professor of Economics, and colleagues.

Picture the departure display at an airport, “DELAYED” flashing in big, bold letters next to a few unlucky flights. Weather in the plane’s previous location, the gate agent might explain, has prevented it from arriving on time, setting off a chain reaction of delays.
Now imagine instead of planes moving people, the vessel in question is a massive cargo ship carting tens of thousands of containers around the world. “Say you have a container ship coming from Shanghai that was supposed to arrive to Los Angeles on December 7. Instead, it arrived on the 9th, and suddenly, a lot of downstream production could not be complete,” says Jesús Fernández-Villaverde, Howard Marks Presidential Professor of Economics and director of the Penn Initiative for the Study of the Markets.
Fernández-Villaverde and colleagues wondered how delays of this sort might affect the global supply chain and in turn, U.S. inflation rates. Tapping into already existing, public data, the researchers found that late-arriving ships jammed up ports, deferring when the goods could be removed and when the ships could leave for their next destination. Inflation rates took a hit in the process.
Omnia asked Fernández-Villaverde to explain the findings from this recently published research and their implications worldwide.

Jesús Fernández-Villaverde, a professor of economics and director of the Penn Initiative for the Study of the Markets (Image: Courtesy of Jesús Fernández-Villaverde)
Why did you start thinking about the global supply chain?
During COVID, specifically in 2022, inflation was getting a little bit out of control. And there was a lot of discussion about why it was going up so much. Some people said it could be because of all of these global supply chain disruptions, but the problem was, we didn’t have a very good measure of them. We figured out that an effective way to measure global supply chain was to look at delays in ports.
What data were you examining to understand these delays?
Every ship in the world has a transponder, which sends its location, speed, etc., up to a satellite. That information lives in a public database that anyone can access. We developed a machine learning algorithm to sort through that enormous amount of data.
We wanted to measure how many ships are stuck outside of ports, trying to get in. Why is this a good measure? Because it turns out that these gigantic ships that move all of these containers around the world operate like buses on a fixed schedule. Let’s say they leave Amsterdam on December 1; they are supposed to arrive to Singapore on December 7, offload 10,000 containers and pick up another 10,000 containers, go to Shanghai and do the same, then go to Los Angeles and back to Amsterdam. They keep doing this on a fixed schedule. Arriving even one day late because of port congestion is extremely costly.
How many cargo ships are actually on the move at one time around the world?
In 2022, there were 5,589. This is actually very important because that’s not that many. These ships are so gigantic that even the world economy only needs a few thousand and, in fact, out of those most of them are small. There are only about 500 of the really gigantic ships in the world, container ships so large that one carries more cargo than the large convoys during World War II. That tells you that just one of them arriving late is a big deal.
What did the port delays reveal to you about inflation?
We applied a state-of-the-art statistical method to measure how much of an impact this had on inflation. We found that most of the reason inflation spiked in 2021 was the global supply chain. So, when the Biden Administration was saying in 2021, “Don’t blame us, this is the global supply chain,” it turns out they were right. But they weren’t right in 2022. By 2022, what we find is that the global supply chain normalized and yet inflation was still high. We realized this was the Federal Reserve System dropping the ball, that it should have been more aggressive against inflation to start building momentum. It was a little too slow to react.
What are the implications of what you found?
We need to know how to react if tomorrow there is yet again a very large disruption to the global supply chain. Suppose there is a war in East Asia. How should economic policy react? How should monetary policy react? That was the big motivation. Beyond that, I’ve been disappointed that not a lot of researchers have done COVID-19 follow-up. There doesn’t seem to be a lot of interest in saying, “Let’s review the game from last Sunday to think about how we are going to play the game next Sunday.” That’s always less attractive to publish but to me, it’s really important.
Will you use these data and tools to look at anything else?
Once you have information about where the ships are, you can actually do a lot. We are already working on some extensions. Right now, for instance, we’re working on an index of the Panama Canal so we can measure things like the traffic through the Panama Canal. What is the traffic in the Suez Canal? How has the traffic in the Suez Canal been affected by all the piracy in the Red Sea? That gives us a lot of information about the global supply chain, and how policymakers should react to it.


