Since the last ice age peaked about 20,000 years ago, waters flowing from melting glaciers back into the ocean have caused the global sea level to rise by about 410 feet. This change, though large, is one of many natural oscillations linked to the Earth’s cycle of long-term climate change. Less clearly understood by scientists, however, are the patterns and causes of short-term sea level change, especially in relation to global warming.
Andrew Kemp and Simon Engelhart, doctoral students and members of the Sea Level Research Team in Penn’s Department of Earth and Environmental Sciences, are exploring these issues by employing cutting-edge data gathering and analysis techniques on salt marshes along the East Coast of the United States.
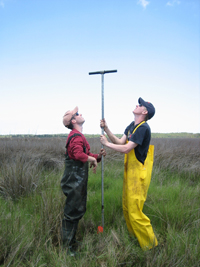
As part of his dissertation research, Kemp has produced what he calls a high resolution record of the rise in sea level over the past 2,000 years based on core samples of sediment from salt marsh sites in North Carolina. He analyzed the samples by looking at microfossils of single-celled organisms called foraminifera.
“Foraminifera are very particular about where they live in salt marshes—some like to be wet all day, every day, and some are quite averse to salt water,” he says. “You get this very distinct pattern from the high marsh to the low marsh.”
Kemp ascertained the inhabitation preferences and number of foraminifera preserved in each layer of his core samples. He combined these findings with new methods of evaluating the age of these layers—for example, comparing the number of pollen grains in the sediment to historical records of European settlements or measuring additional carbon isotopes caused by above-ground nuclear weapons testing in the 1950s and ’60s. As a result, he was able to reconstruct sea level rise for the past 2,000 years on a scale of inches and decades rather than the resolution of feet and hundreds of years provided by traditional salt marsh data.
Kemp also found that tide gauge records from North Carolina over the past 100 to 150 years show an accelerated rate of sea level rise in comparison to the long-term geological rate.
"We're showing that sea level rise is not just a simple case of glaciers on land melting." - Simon Engelhart
“Tide gauges only go back to the 1900s and they show a rate of sea level rise that is higher than anything we’ve seen in the past 2,000 years,” Kemp says. “At some point between the two, the rate changed, and I’m currently analyzing these high resolution records to understand when the acceleration took place. Pinning down the timing is crucial to understanding whether this acceleration has an anthropogenic cause.”
Engelhart’s research focuses on using new methods of analysis to coax a more accurate picture of 20th-century sea level change out of tide gauge data gathered from salt marshes along the U.S. East Coast, from Maine to South Carolina. He explains that, in addition to changes in the amount of water in the ocean, land subsidence—the lowering of land-surface elevation due to changes underground—is also a factor in sea level rise.
“All the tide gauge records we have now are contaminated by land movement,” Engelhart says. “In my research, I try to find ways to remove land subsidence from the equation.”
As a result, he found a previously undetected pattern in sea level change along the East Coast. It is widely accepted that sea level has been rising globally by 1.8 millimeters a year during the 20th-century, but Engelhart says that researchers didn’t have a good idea of how that related to the region. His research reveals that although the average change on the East Coast is representative of the global change, sea level rise actually shows a trend of increasing from north to south. The rate is approximately 1.4 millimeters per year in Maine but 2.6 millimeters per year in South Carolina.
“We’re showing that sea level rise is not just a simple case of glaciers on land melting,” Engelhart says. “For example, this pattern may be a fingerprint of changes in the Earth’s gravitational field due to the melting of the Greenland ice sheet or it may be due to water in the ocean expanding because of the climate getting warmer. There’s a lot of research that needs to be done to pull apart what the additional controls on sea level rise during the past century have been.”
Kemp and Engelhart completed their undergraduate degrees at Durham University, a leading institution for sea level research in the United Kingdom. There they studied under Ben Horton, who has been an assistant professor of earth and environmental science at Penn since 2004 and is the key faculty member on the Sea Level Research Team. They came to Penn to continue their work with Horton and to take advantage of the unique data available on the U.S. East Coast.
The region contains a high concentration of salt marshes, which occur at a very narrow range of tide levels. “If you have a salt marsh deposit,” Engelhart explains, “you have a very precise control on where sea level must have been.” East Coast salt marshes also have high levels of organic materials, relative to similar environments in Europe, and their location in a straight line perpendicular to Greenland makes them ideal locations to study the effects of one of the world’s two remaining ice sheets.
“The U.S. East Coast is like a natural lab,” Engelhart says. “If you’re going to make some of these discoveries, this is the place to do it.”